How someone who hated math learned to use geometry, calculus, etc...
Melvin Prueitt images below used with permission of the author. These images were created by optically scanning pages of the book, so the quality is somewhat reduced.
I had a very rigid math teacher in high school, at the time when we were transitioning into algebra, geometry, etc.. He had a written agenda for the whole year, and simply refused to go back over past material. Well, (and this should make you laugh) the one item I didn't understand is "What is a variable?" You can imagine that at the time, this basically stopped me from understanding all the future math. I just BARELY scraped by with enough credit to pass that class, and hated math because of it, for several years.
Then, in the late 1970's and early 1980's, I began seeing personal computers that I might be able to afford, and coincidentally, found several books that described how to write simple (various versions of "BASIC") programs. I used the computer in bands I was in, to do text-oriented things, like set lists, mailing lists, table tents, song lists, etc..
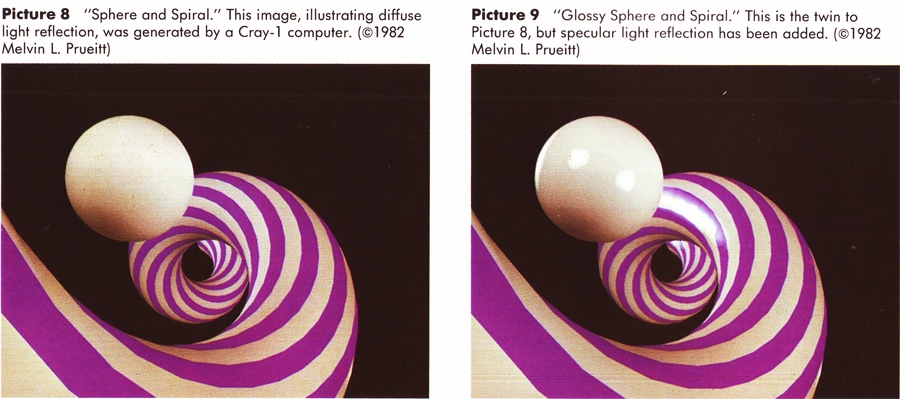
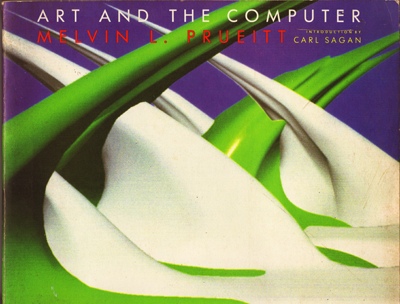 There were also 3D plotter programs, essentially function plotters, but over a cartesian grid, in 3D. "Graphics" were impossibly slow, and the resolution was, (on a Commodore 64, for example) 320X200, and only 8 colors. Still, NASA was showing us the future, via the Cray Supercomputer, and there was a pivotal moment in 1983, when I passed by a book store, and saw a gorgeous book by NASA Physicist/Inventor Melivin Prueitt, called "Art and The Computer". That's when I knew I wanted to get into 3D. As a musician on the road all the time, this studying and programming gave me some entertainment during all that time in hotels.
That's where the learning curve started for me. I ran the programs, looked at the results, then (RANDOMLY) changed variables, ran the program again, and looked at the results, keeping careful notes during the process. It was the VISUAL result that kept me interested... Using the math I hated, to produce pleasing graphics.
Ultimately, I came to have a basic understanding of the various math functions, and also the "scaling factors" used in the programs, which converted the 2D formulas into 3D graphics with the illusion of perspective. During that process, I created a catalog of formulas that created individual shapes, which I simply thought of as "mountains", "valleys", "craters", etc..
The general flow of these programs, as originally written, was:
- Initialization of variables - This also involved creating at least two sets of empty arrays, to hold the current loop's variables, and the previous loop's variables, so a comparison, for hidden-line removal, could be done.
- Creation of the visual interface. The best we could do would be considered pretty clunky, by modern standards. There was very little screen real estate, no "mouse", no "pop-up" or "pull-down" menus, etc.. Slow computers with almost no RAM and external storage.
- User input of visual parameters, like "distance", "scale", "rotation", etc..
- User selection of a particular formula to create the shape
- Then, based on the cartesian grid, (say, from -PI to PI) the program would loop through all the variables and produce that shape. Whatever the pixel-by-pixel results of the 2D equation were, the result then had to be adjusted twice... First, add whatever user-defined "perspective" and "rotation" variables were set at, and then again, to plot the results on a 2D computer monitor. Each "run" of these simple function plotters took hours in those days, so this wasn't a quick process, running on computers like the Sinclair 2068 and later the "QL", as well as the Commodore, Atari, and Apple computers of the day. The image below seemed very advanced, at the time.
Digital Flashback...
If you're old enough, you'll remember walking into computer stores in the 1980's, and seeing the "bouncing soccer ball" demo, running on the Commodore "Amiga". The computer could do that, but only when ALL of it's computing and RAM resources were dedicated to it. Later, I remember running my first program on the Atari 512 that demonstrated ray tracing. The program was written by Tom Hudson, and took 24 hours to create a single "stock" image. (Remember, that's 512 K... Not 512 Megabytes) Fractals used to take 12 hours per frame.
Aside from the "function" math, there was the issue of "hidden line removal", so the structures could appear reasonably solid. I spent years on that, as various techniques developed. At first, these were all plotted as "meshes", and later, we all worked on ways to fill the polygons, so that the shapes could appear more solid.
All of that early software used "Z" as the vertical axis, so the portion of the programs that defined "height above or below zero" was typically referred to as "z=(the 2D formula's result)" (MODO uses "Y" as the vertical axis).
Once I understood how to plot individual shapes, I rewrote the developing version of the program I had, to allow for multiple choices by the user. (Build a "mountain" or a "crater".) In the program text, I labeled these variations "z1", "z2", etc.. and later added a "multiplier" variable. This was like "z=size X formula", so the user could easily adjust the scale. This "height" variable could be negative, too, turning a "mountain" into a "valley".
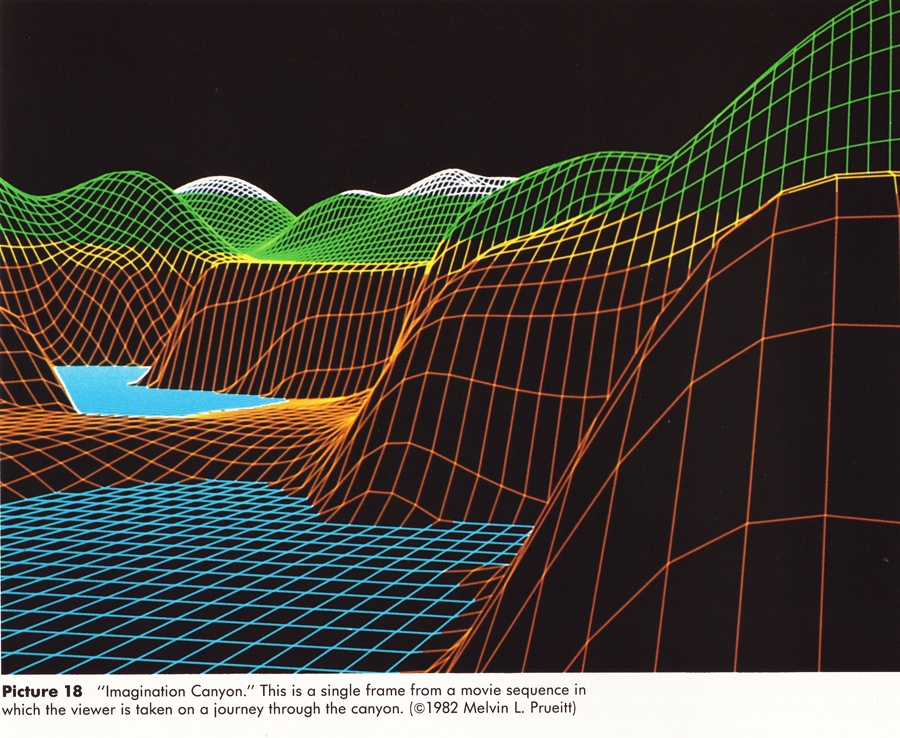
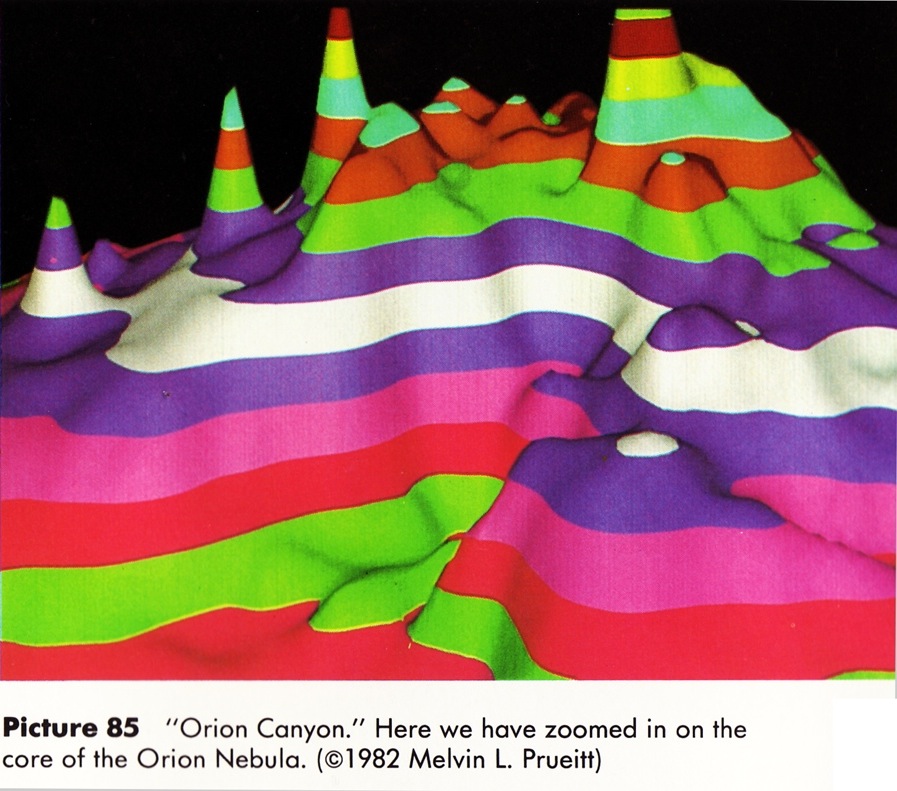
This is the point where my idea of combining formulas came about. The user had a cartesian grid available, so it became possible to do this... First, an area of the grid was selected. Then, at that point on the grid, the user could select a single formula, or combine them. (example might be making a "crater", with a "ridge" running through it. The program logic simply combined them like this: "z=z1 X height", plus "z2 X height", plus "z3 plus height", etc., for each point on the grid. Suddenly, I could create complex, organic-looking "terrain". (wire mesh type, in those days) The final step was to add a "skewing" variable, which could either be fixed or random, based on certain conditions. That let me build the same kind of terrain, but with CURVING, or "SNAKE-LIKE" parts, instead of only bilaterally-symmetrical shapes, which tended to look unnatural. The final touch, (when we finally had computers that could do more than 4 to 8 colors) was to add some "color by height" variables to the plotter. Typically, these would be blue at "zero", (intimating water) green in the middle (intimating "grass" or "general terrain", and red at "max height", simulating volcanoes, etc..
A little nostalgia... Here's an example of "Terrain 3D", running on a modern Mac, via a QL emulator.
At the time, it seemed "obvious" to me, but when I submitted the compiled program to a few people for them to evaluate, everybody wanted to know how I did it. I was surprised to find that although I was a "math idiot", I had apparently invented a new way of doing these things.
When I got this far, which was in the mid 1980's, I sold the program, then called "Terrain3D" to Digital Precision Ltd., in the UK. (a popular distributor of software and a C compiler for the Sinclair QL) Coincidentally, computers had improved enough by that time that I felt I no longer needed to be a programmer, and decided to simply become a "user". Today, the kind of thing I produced in the early 1980's are "thrown in for free" as screen savers or simple function plotters, and my newer interest in 3D is the kind of models you see here, and on my archive site at http://www.nextcraft.com.
Finally, I was able to teach myself how to use some very complex, multi-variable math, without ever REALLY understanding it. Beautiful graphic images, like Melvin Prueitt's, were my motivation, rather than simple text results on paper, and kept my interest through the (long) learning period. The benefit of being that kind of a programmer for about 10 years was that it sharpened my ideas about general logic, and "hierarchy", and that's been helpful in planning other projects. The visual aspect of the math was hugely helpful in my understanding, and gave me the motivation to learn it, which I never had in school.
Later...Diving into "real" 3D.
Since the 1950's, watching "Sky King" on TV, I've been fascinated with aviation and aerospace. Later, I became a pilot, and skydiver, so it was a natural progression to do some aviation-related 3D work. My site at http://www.nextcraft.com is the result, and showcases a lot of 3D/CAD work of that type. ("clunky", by today's standards)
![]()
An original RC aerobatic design
Today...
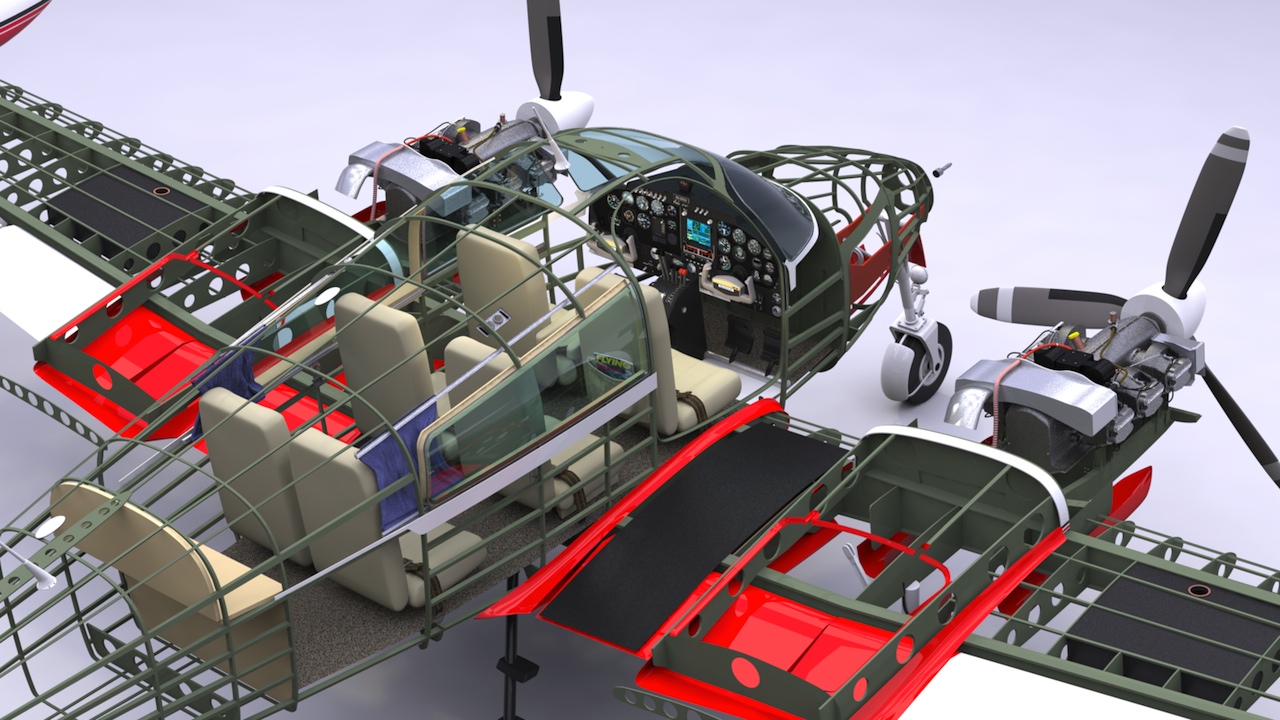
"Carrara Studio" served me well when I was using it, but in September of 2008, I transitioned to The Foundry's "MODO", and feel much better-equipped to produce the kind of models I've dreamed of for many years.
More modern work in MODO - My Cessna 310K model, and my Piaggio "Avanti II" P180 project.